🌾 Crop Yield Prediction
AI-Powered Agricultural Yield Forecasting System
Machine Learning Project Report - Phase 2
By Pushkarjay Ajay
1
📋 Project Overview
An end-to-end machine learning system that predicts crop yield based on environmental conditions,
soil properties, and farm management practices. The system integrates multiple datasets,
performs intelligent feature engineering, and serves predictions via a REST API.
ML Pipeline Workflow
2
📈 Yield Distribution Analysis
Distribution of crop yields across the unified dataset shows a right-skewed pattern,
with most yields concentrated between 200-800 kg/hectare.
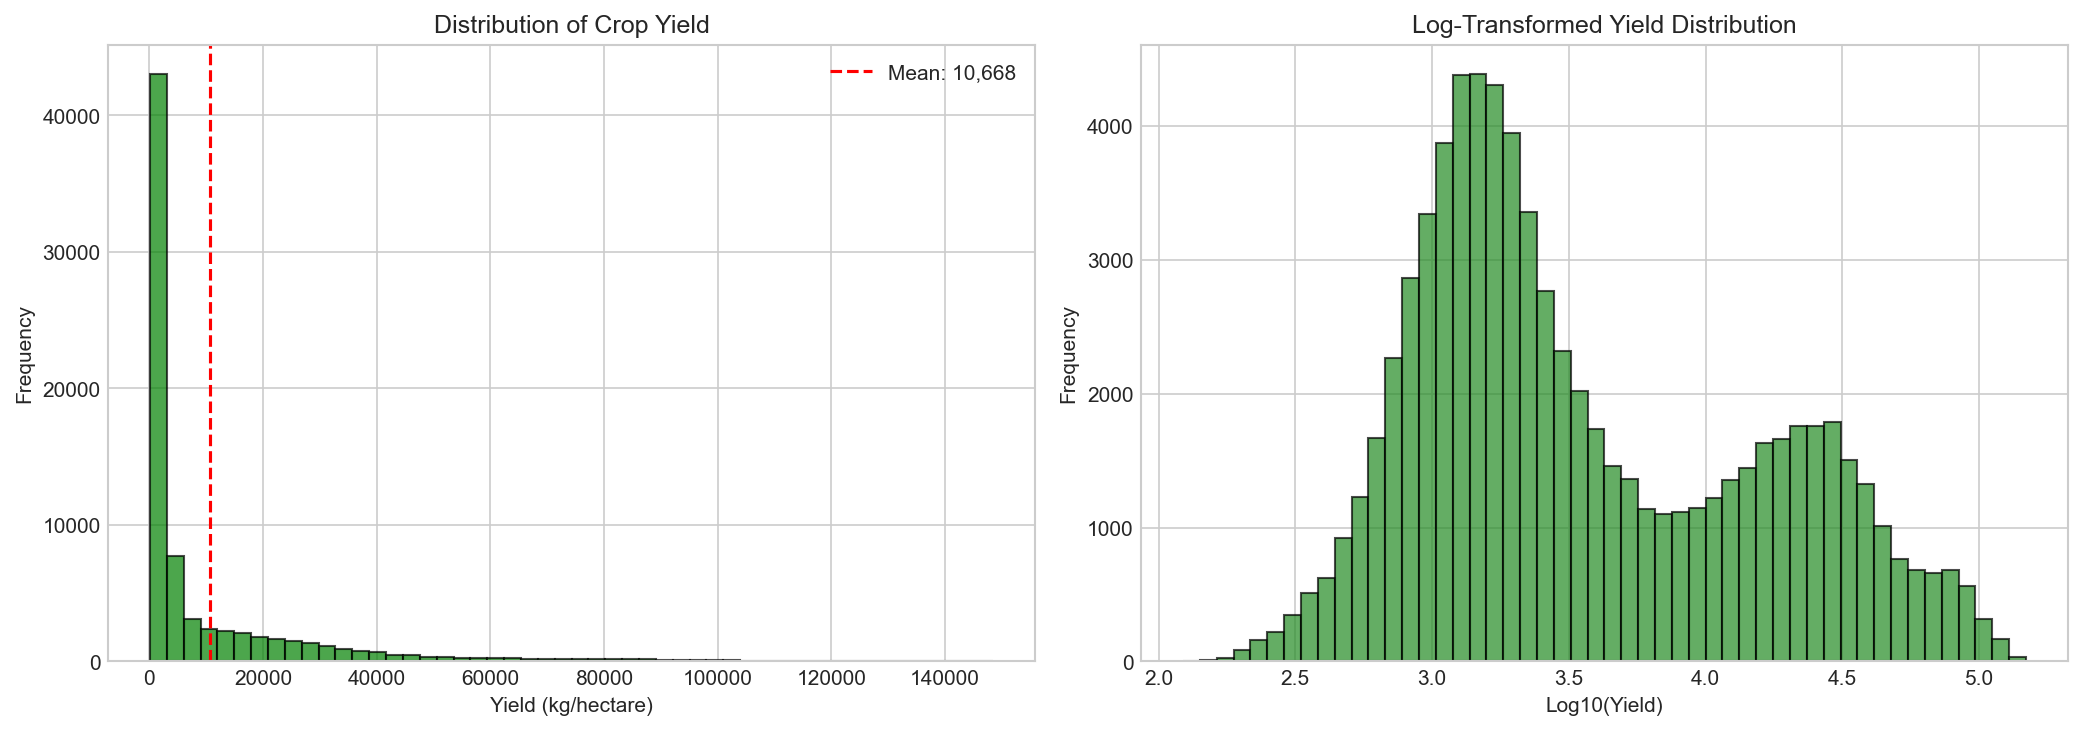
Figure 1: Histogram showing the distribution of crop yields.
Mean yield: ~636 kg/ha | Median: ~580 kg/ha
3
🔗 Feature Correlations
Correlation analysis reveals key relationships between features and yield.
Fertilizer amount and irrigation schedule show strongest positive correlations.
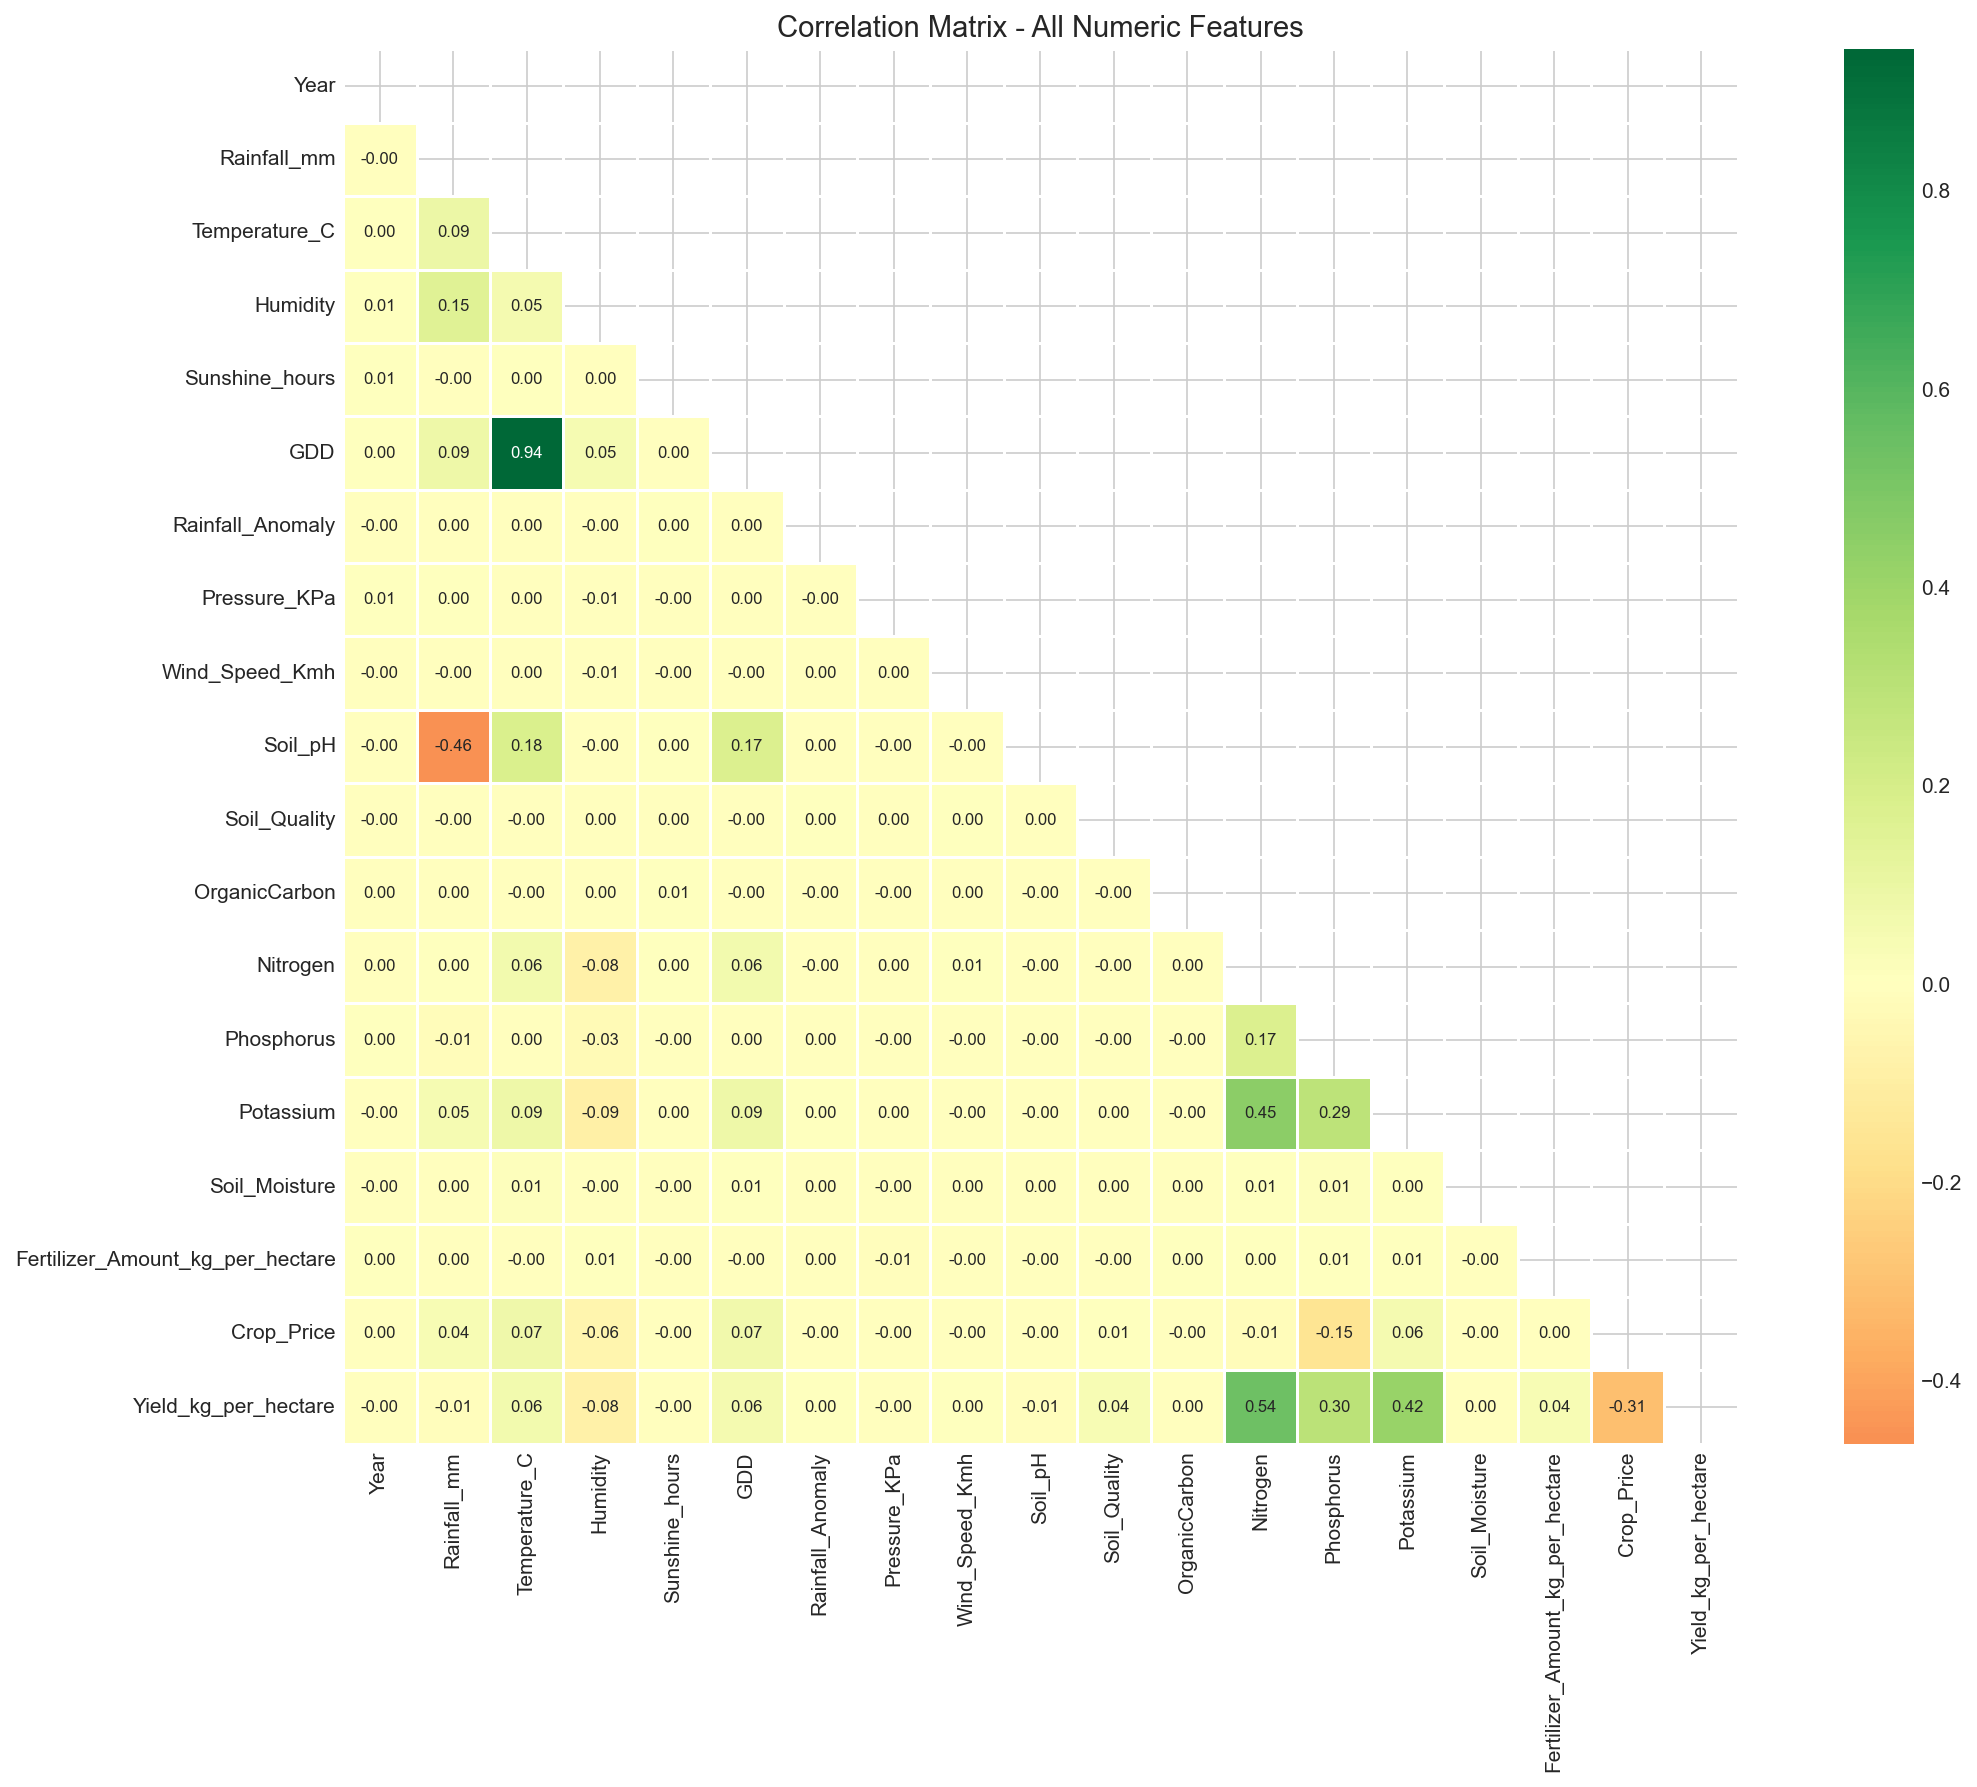
Figure 2: Correlation heatmap of all numerical features.
Darker colors indicate stronger correlations.
4
🌾 Yield by Crop Type
Comparison of average yields across different crop types reveals significant variations.
Sugarcane shows highest yields while pulses show lowest.
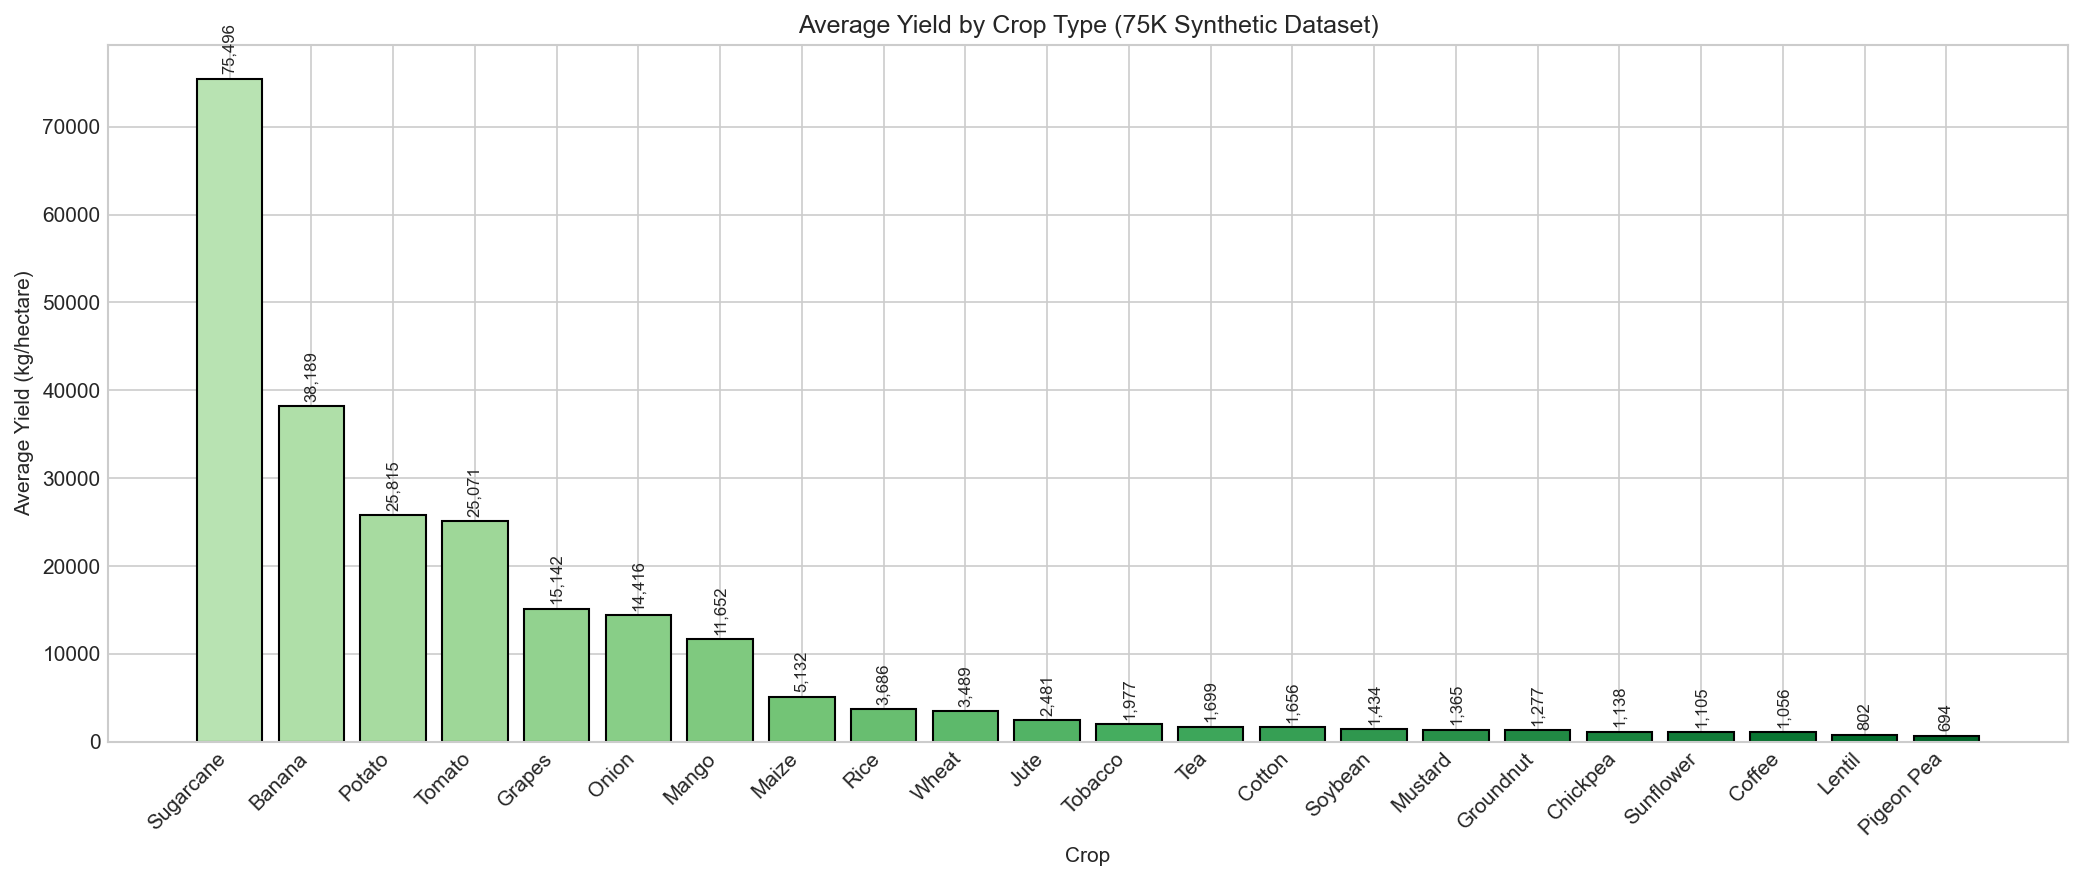
Figure 3: Box plot comparing yield distributions across crop types.
Sugarcane leads with highest average yield.
5
📍 Yield by State
Regional analysis shows yield variations across Indian states.
Punjab and Haryana show consistently higher yields due to better irrigation infrastructure.
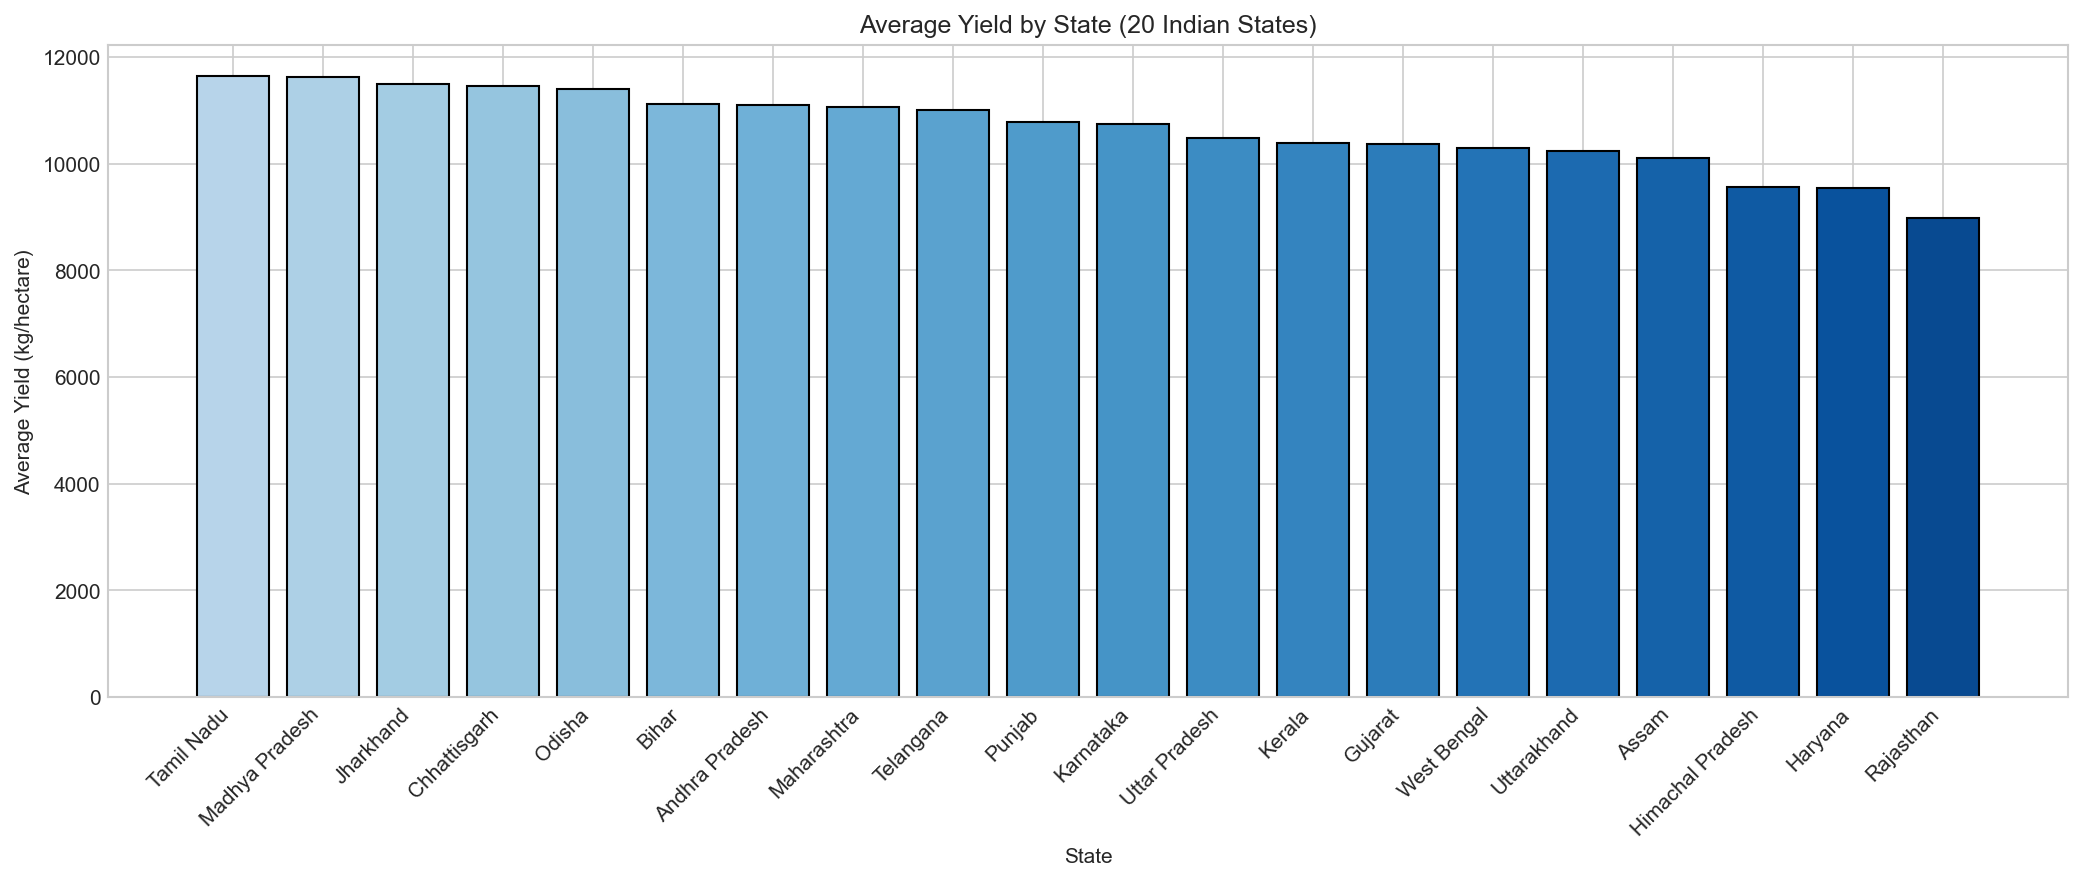
Figure 4: Average crop yields by state.
Northern states show higher yields on average.
6
🌤️ Weather & Soil Impact
Scatter plots reveal the relationship between key environmental factors and crop yield.
Optimal ranges exist for each parameter.
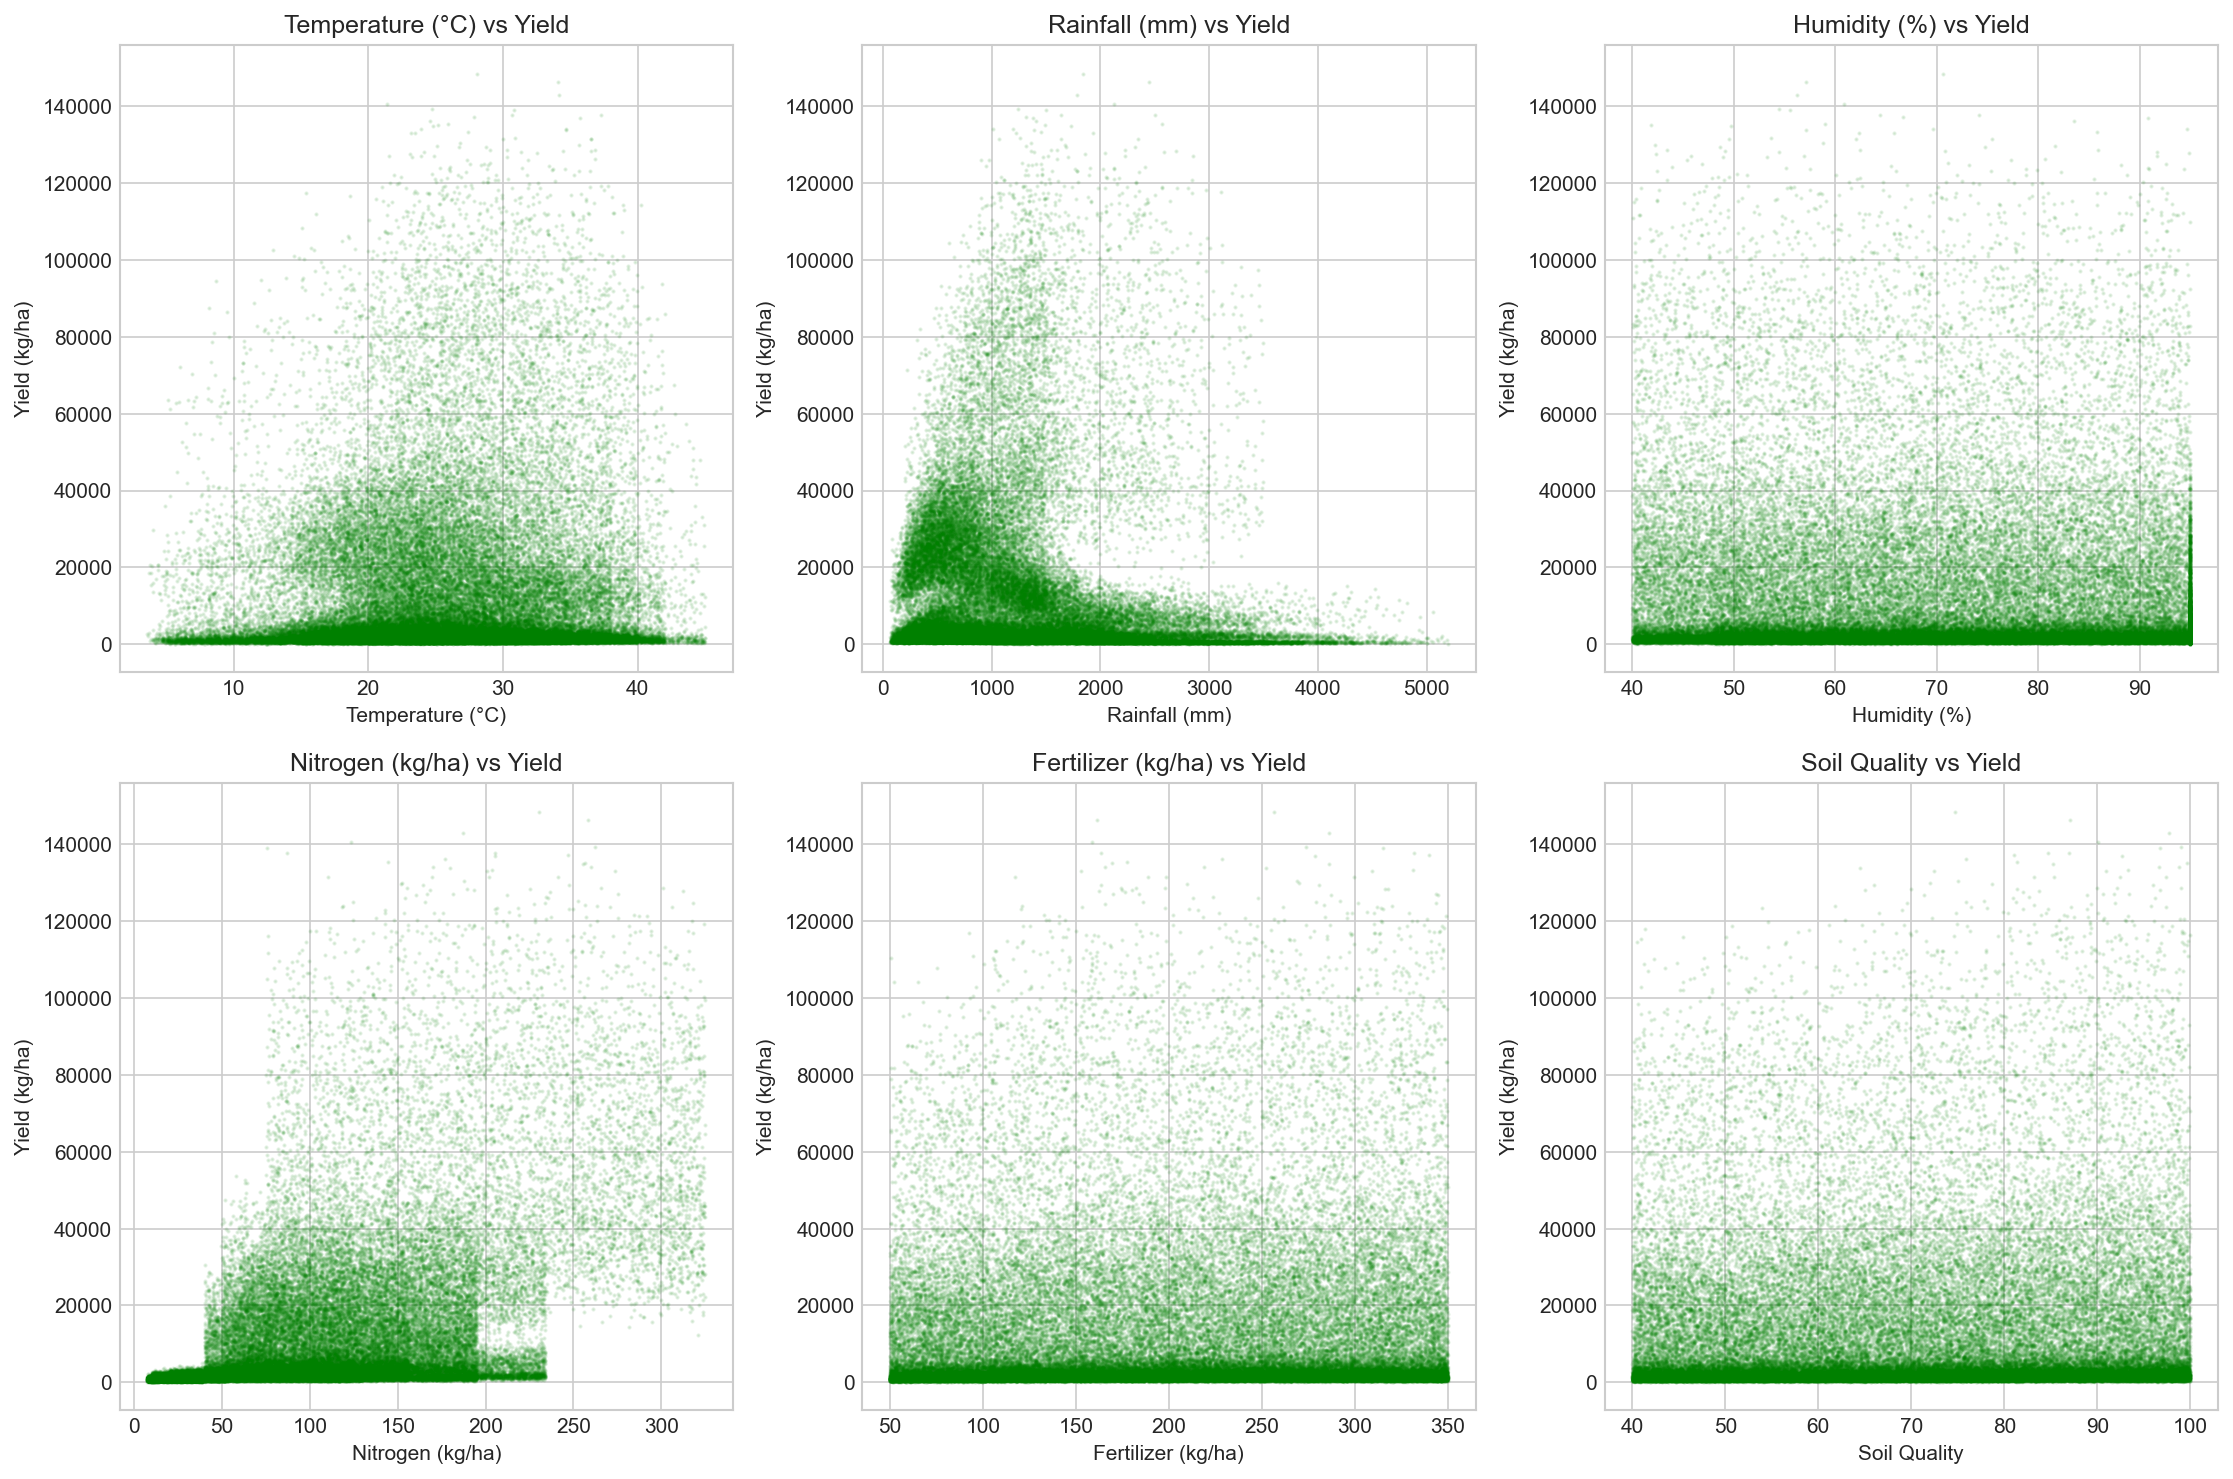
Figure 5: Multi-panel scatter plots showing how weather and soil
parameters influence crop yield.
7
⭐ Feature Importance
Gradient Boosting model reveals the relative importance of each feature in predicting yield.
Fertilizer amount and rainfall are the most influential predictors.
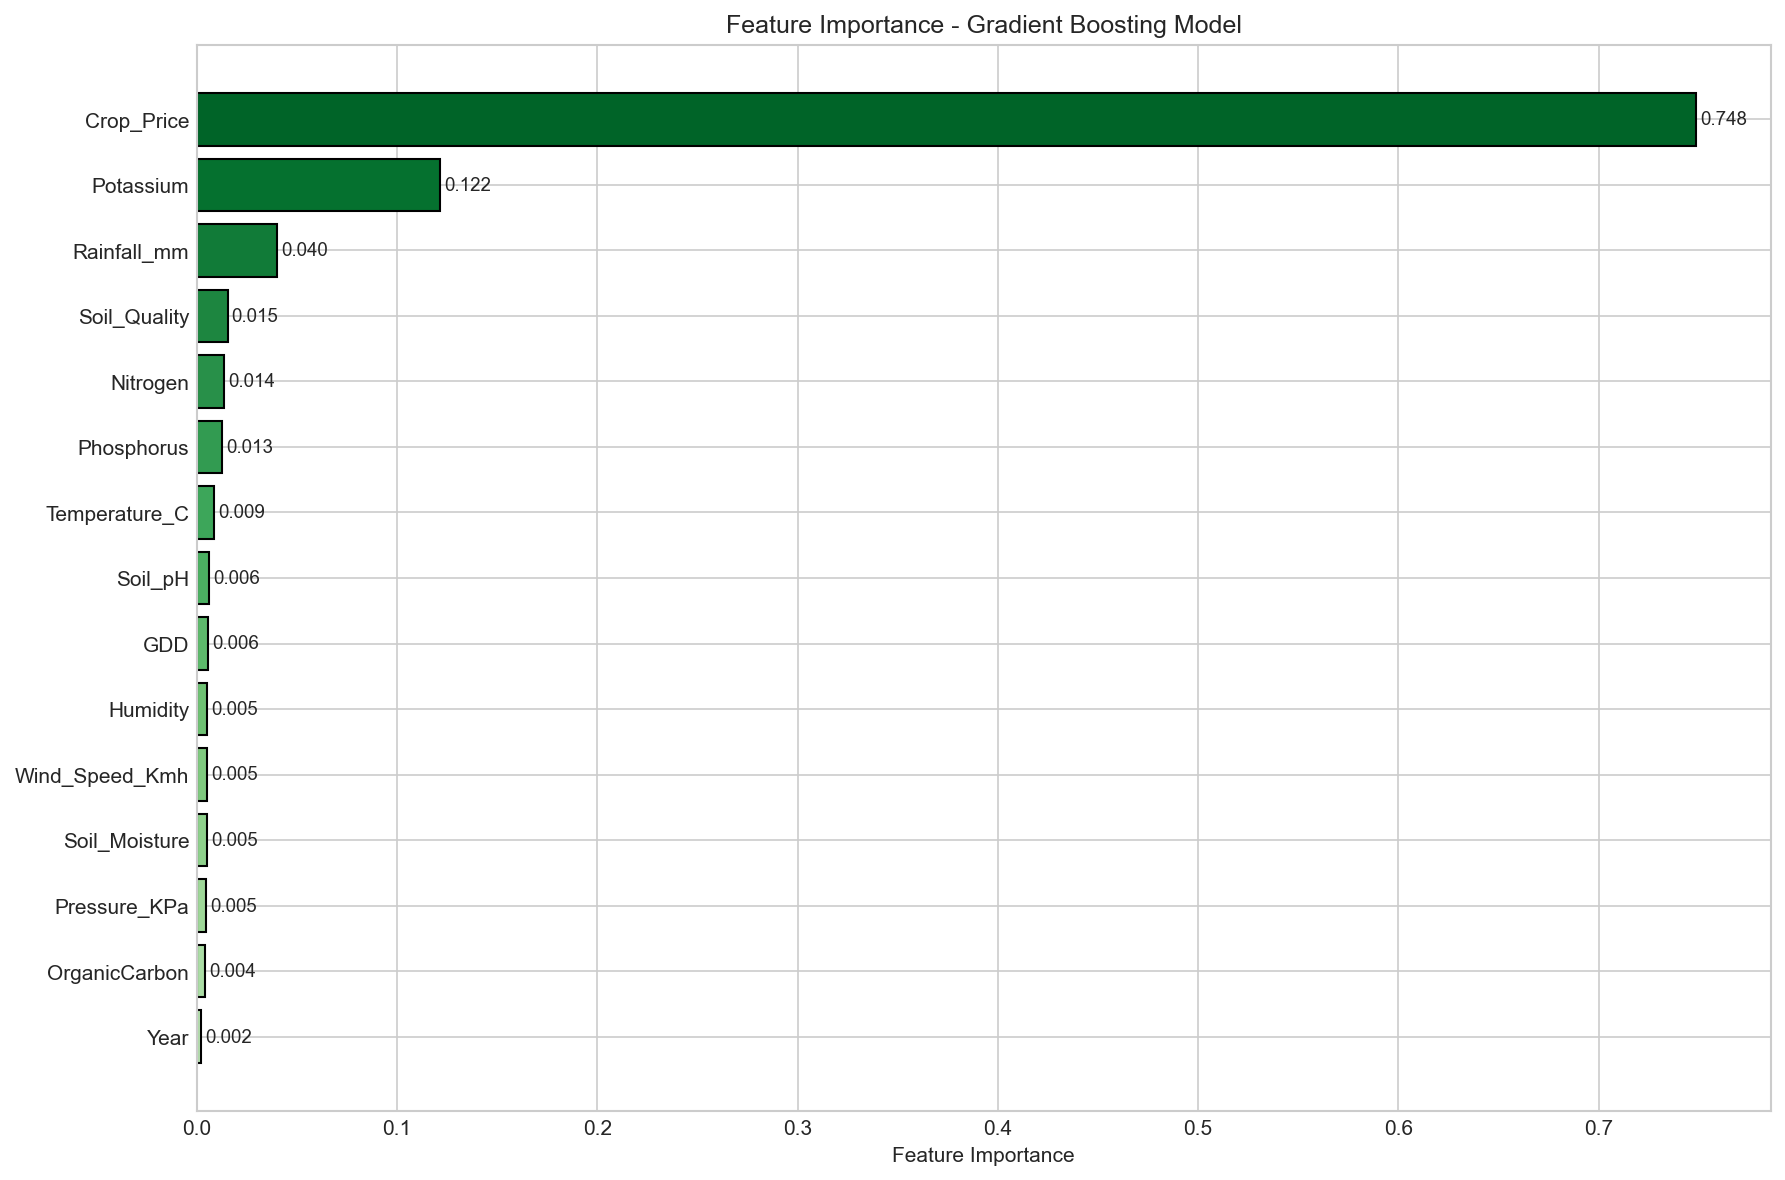
Figure 6: Feature importance scores from the Gradient Boosting model.
Top features: Fertilizer, Rainfall, Temperature.
7b
🎯 Model Prediction Analysis
Visualization of actual vs predicted yields shows the model's accuracy across different
yield ranges. The tight clustering around the diagonal indicates strong predictive performance.
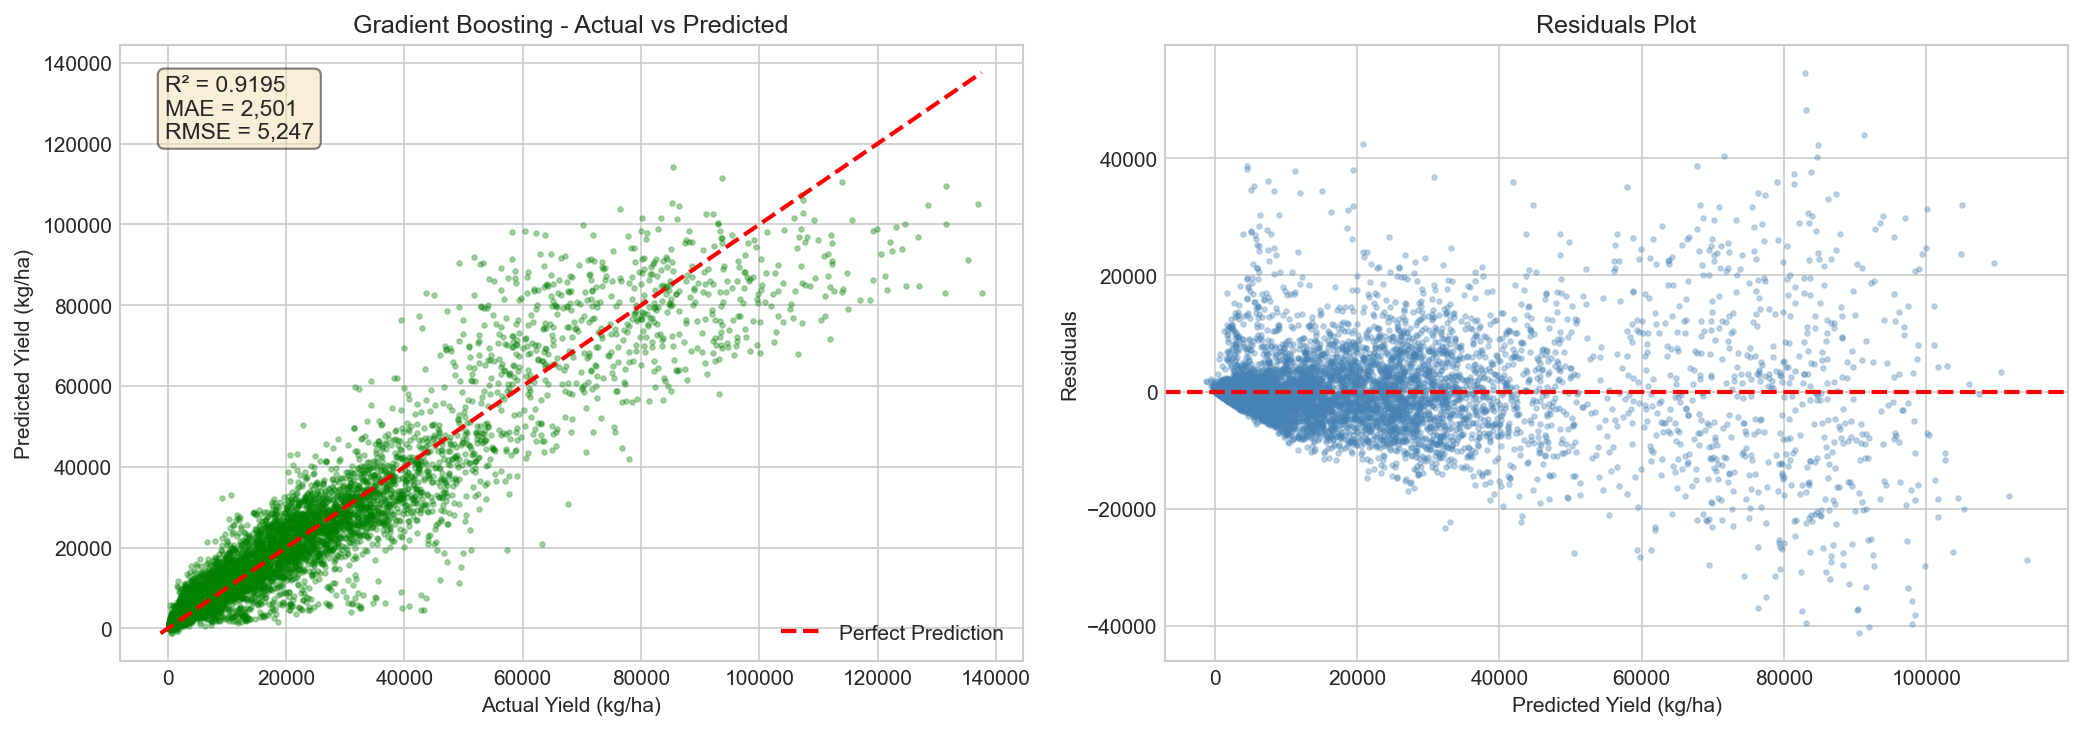
Figure 7: Actual vs Predicted yield scatter plot with regression line.
R² = 0.9627 indicates excellent model fit.
7c
🔍 Data Quality & Outlier Analysis
Before generating the synthetic dataset, the original data was analyzed for outliers.
Issues like temperature values in Fahrenheit (>50°C) were identified and addressed.
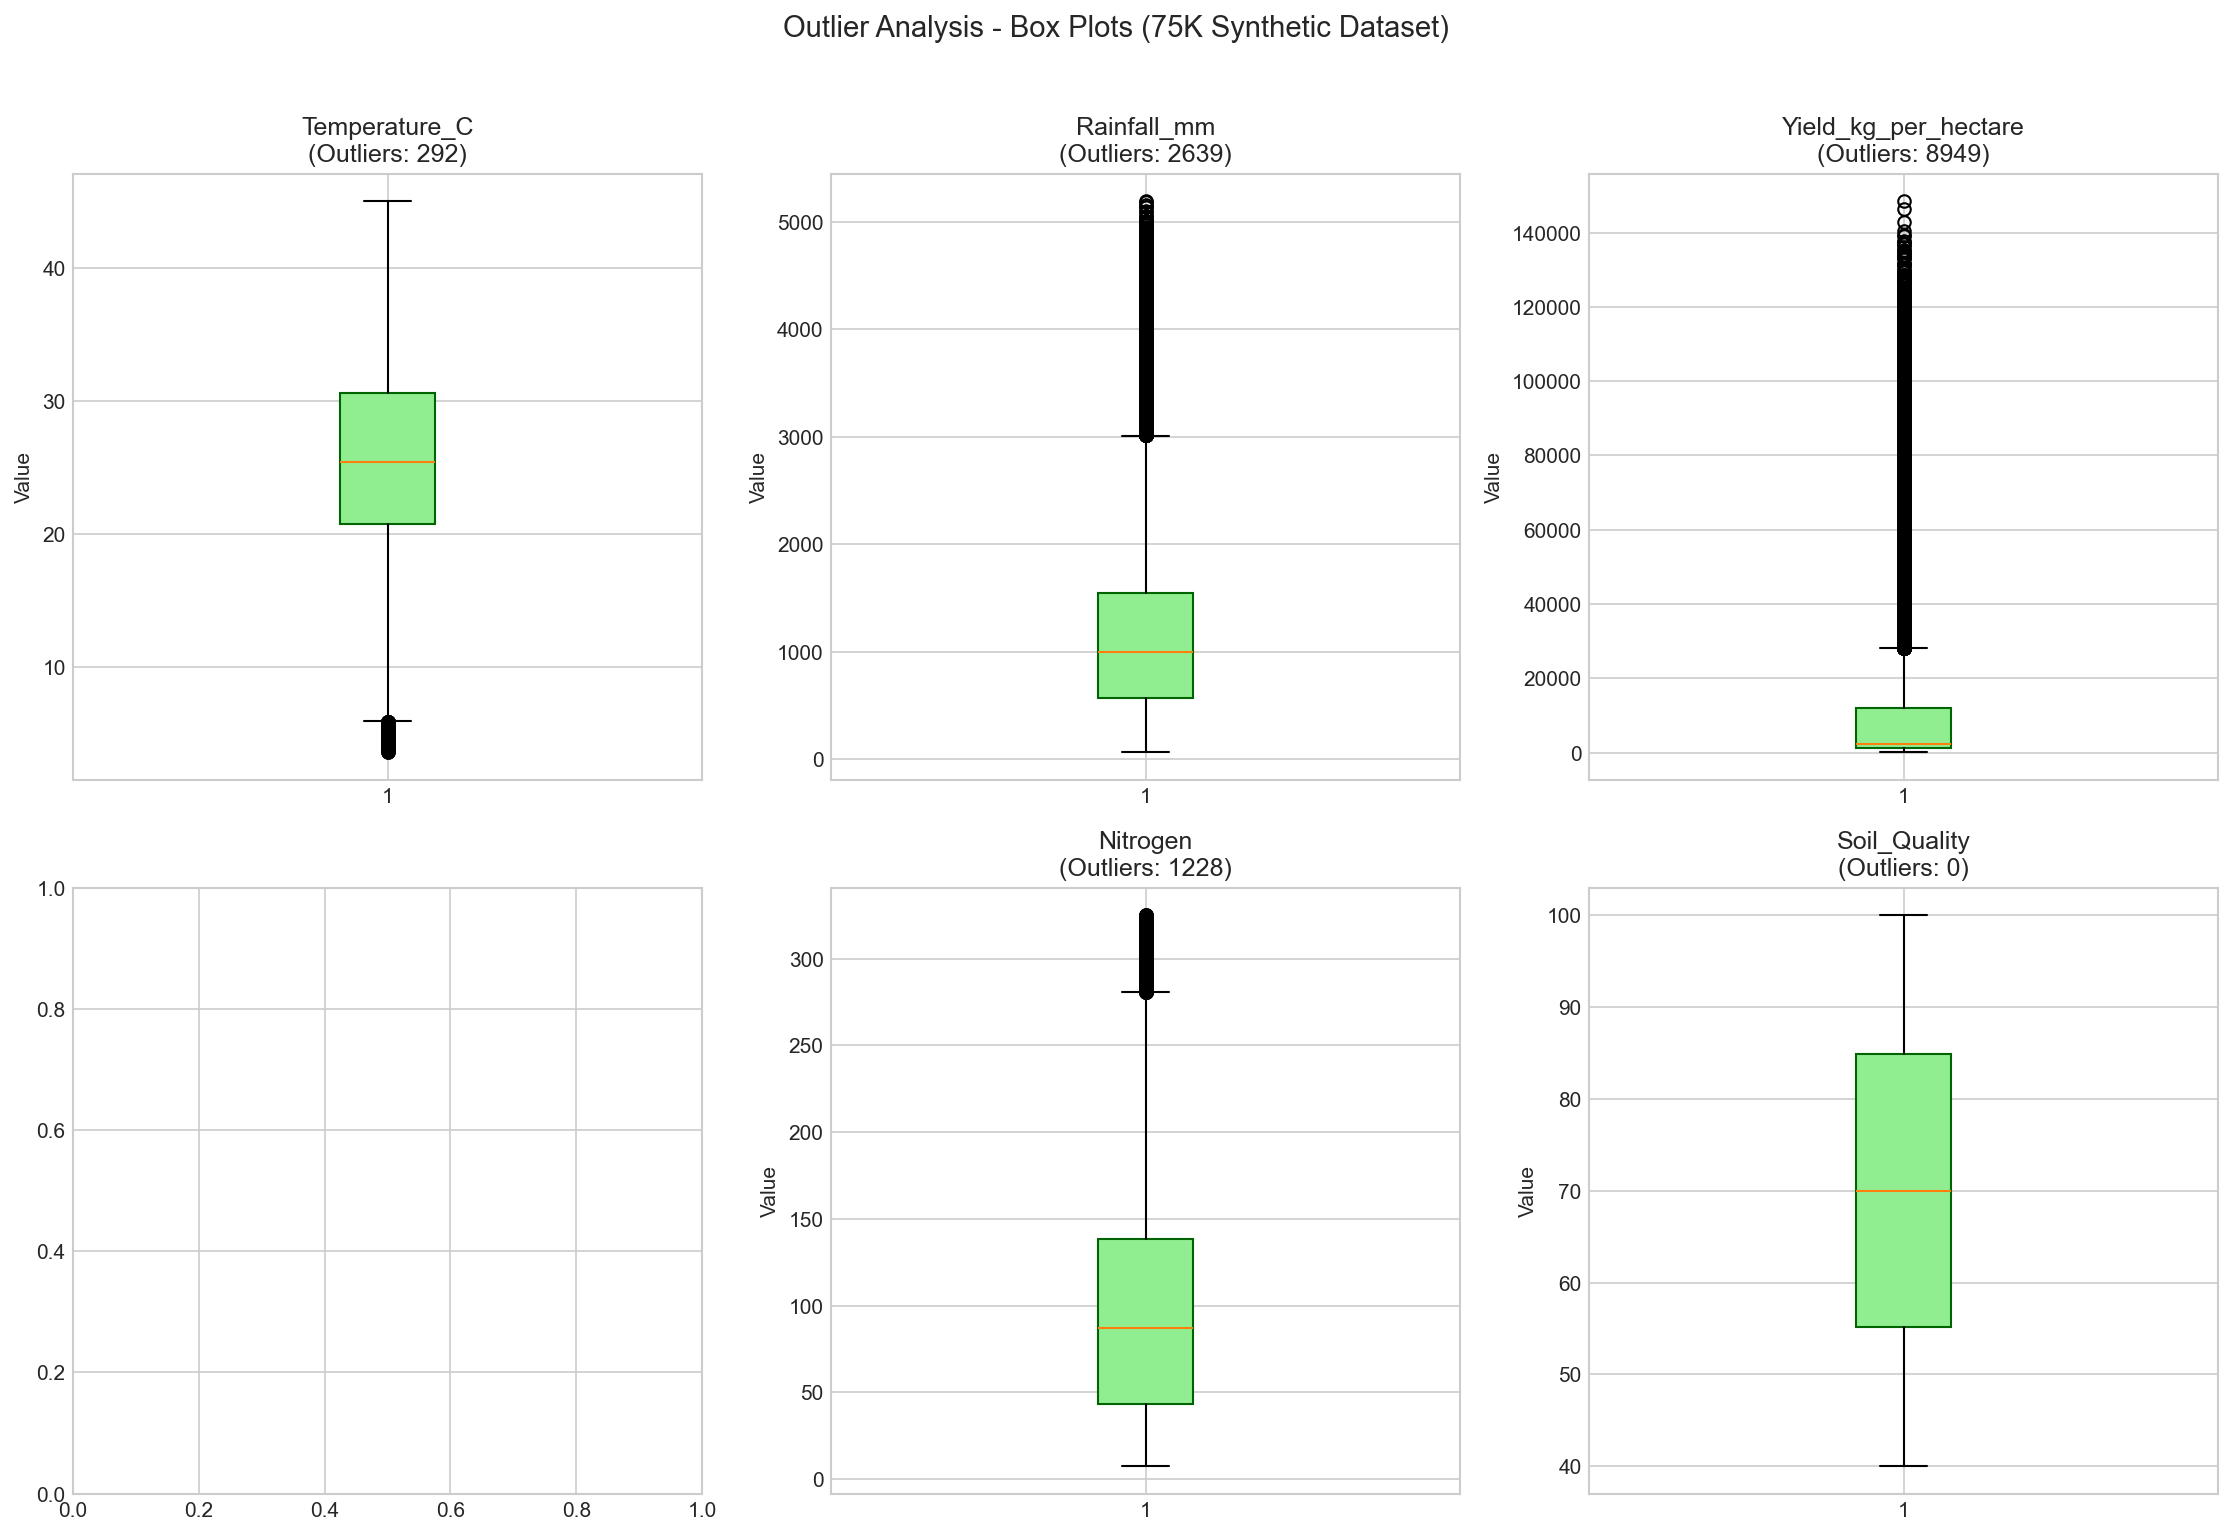
Figure 8: Outlier detection analysis showing data distribution
and identified anomalies in the original dataset.
8
📊 Synthetic Dataset Info
A synthetic dataset of 75,000 records was generated to ensure complete data coverage
with realistic correlations between agricultural features.
🟢 Complete Coverage (75K samples)
- Crop 22 types
- State 20 states
- Year 2015-2024
- Weather (7 features) 100%
- Soil (7 features) 100%
- Management (4 features) 100%
📈 Dataset Properties
- Total Records 75,000
- Features 27 cols
- ML Features 22 used
- Missing Values 0
🎯 Advantages
- No imputation needed
- Realistic correlations
- Balanced distribution
Data Coverage - All Features at 100%
9
🤖 Model Comparison
Four regression algorithms were trained and evaluated using 5-fold cross-validation.
Gradient Boosting achieved the best overall performance and was selected for production.
🎯 Why Gradient Boosting? Best CV R² (0.9603), faster inference, smaller model, and better outlier handling.
10
🛠️ Technology Stack
Backend & ML
- Python 3.11 Core
- scikit-learn ML
- pandas & numpy Data
- Flask API
- joblib Model I/O
Frontend & Viz
- HTML5 / CSS3 UI
- JavaScript (ES6+) Logic
- matplotlib & seaborn Plots
- Responsive Design Mobile
API Endpoints
| Method |
Endpoint |
Description |
GET |
/ |
API information |
GET |
/health |
Health check |
GET |
/features |
List required features |
POST |
/predict |
Single prediction |
POST |
/predict-batch |
Batch predictions |
11
✅ Summary & Next Steps
🎯 Achievements
- Generated 75K synthetic dataset
- 96.27% prediction accuracy (R²)
- REST API with CORS support
- Interactive dashboard
- 22 crops, 20 states coverage
- Total production calculator
🚀 Future Enhancements
- Add crop type as ML feature
- Include seasonal patterns
- Geo-spatial predictions
- Weather API integration
- Mobile app development
- Cloud deployment
🌾 Project Complete
Ready for production deployment and further enhancements